
AUD/CHF – Charts & Analysis
As of writing: Strength Vs Weakness Tables Standings
- AUD is showing S3 (strong) and S1 on the Trend and Day trading tables respectively
- CHF is showing W2 and W1 (weak) on the Trend and Day trading tables respectively

Primary Observations:
- The daily chart above shows CADCHF forming an ascending Triangle pattern
- This pattern is formed from a bull trend line, anchored 31st Jan 2022, formed 22nd Feb 2022
- This pattern is completed by the 0.7050 / 0.7075 resistance zones
- Resistance has held on 3 prior occasions and is currently being tested again
- This pattern is widely seen as a continuation pattern
As always, this chart would be hard to find without my FX Strong Vs Weak Trading Tables (Link to Strong/Weak Tables HERE).
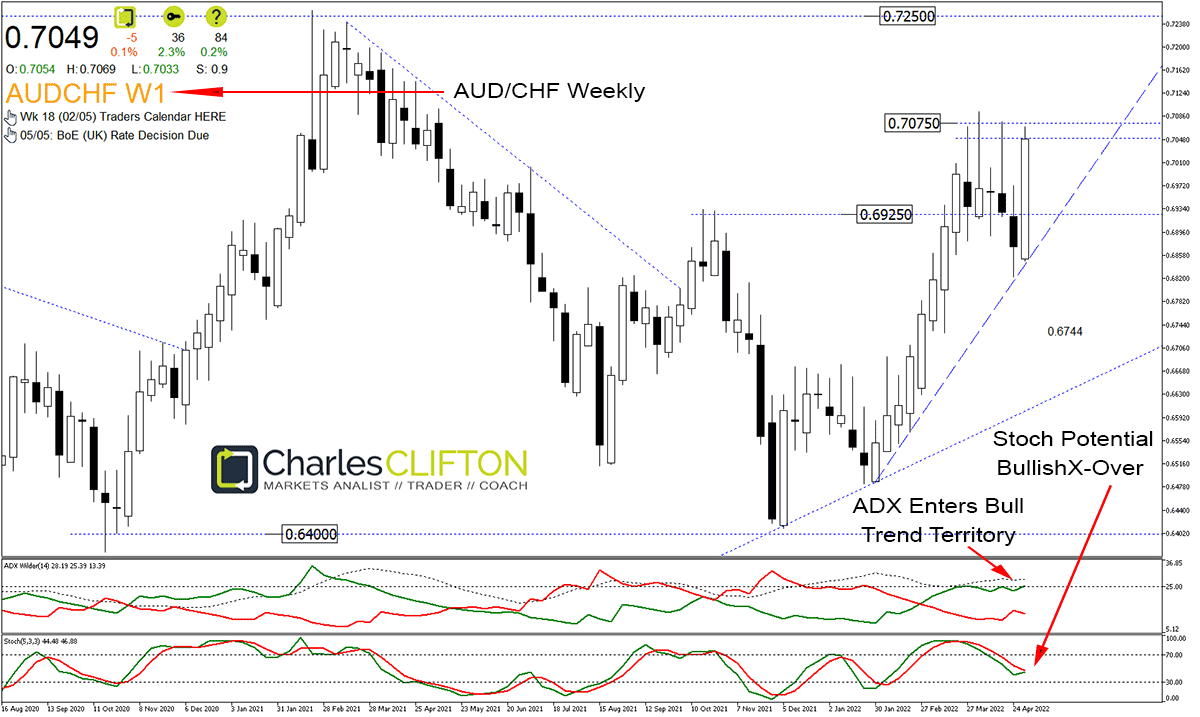
Primary Observations:
- The weekly chart above shows us the bigger picture
- The above mentioned ascending triangle pattern is forming within an existing range pattern
- 0.6400 is Oct 2020 / Dec 2021 range support
- 0.7250 is April 2019 / Feb 2021 range resistance
- This week’s bar is (to-date) some 220 points to the upside
Current Narrative:
- The above mentioned +220p upside move is from trendline support to 0.7075 resistance
- A daily close above 0.7050 would potentially expose 0.7250 range resistance
- Should 0.7075 again hold then a retest of rising (bull) trendline support is possible.
- Either way, something has to give.
My Call:
- I am not currently trading this pair.
- I would be prepared to long this pair on a confirmed daily close above 0.7050
- Alternatively a close circa 0.6950 / 0.7000 on contact with trendline support would provide a safer long entry
- A removal of either CAD or CHF from my S/W Trading Tables (HERE) would of course negate this entire trade plan.
S/W Caveat:
- A removal of either of these currencies from my S/W Trading Tables (HERE) would of course negate this entire trade plan

Leave A Comment
You must be logged in to post a comment.