
CAD/CHF 4th May 2022
As of writing:
- CAD is showing S2 (strong) on both Trend and Day Traders Tables
- CHF is showing W2 and W1 (weak) on the Trend and Day trading tables respectively
CAD has been showing some considerable strength on my Strength Vs Weakness Tables for some time now, primarily due to the increase in the price of its major export: Oil.
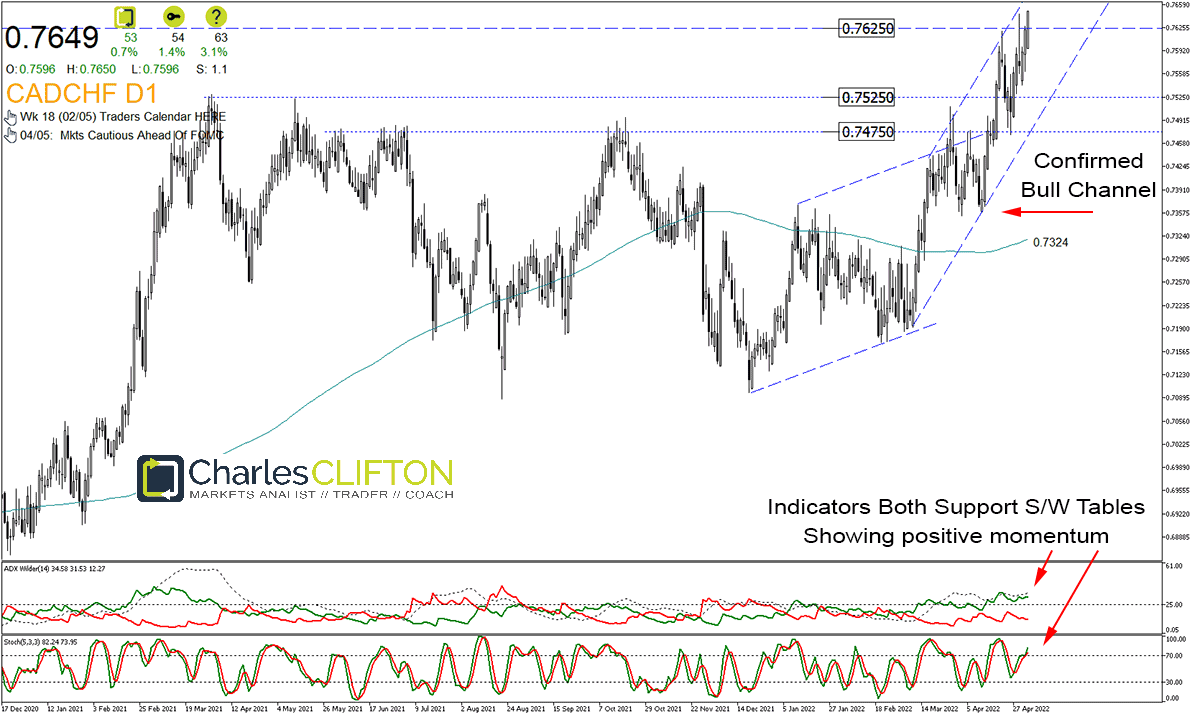
CADCHF Daily Chart
Primary Observations:
- The daily chart above shows the original bull trend anchored Dec 2021, confirmed March 2022
- This confirmation point then became the anchor point for an accelerated bull trend, confirmed 12th April 2022
- We have since see this pair take out a confluence of channel resistance and prior resistance (June ’21) circa 0.7475
- This pair then took out prior April ’21 resistance circa 0.7525
- We now see significant Jan ’19 prior resistance being tested/challenged
As always, this pair would be hard to find without my FX Strong Vs Weak Trading Tables (Link to Strong/Weak Tables HERE).
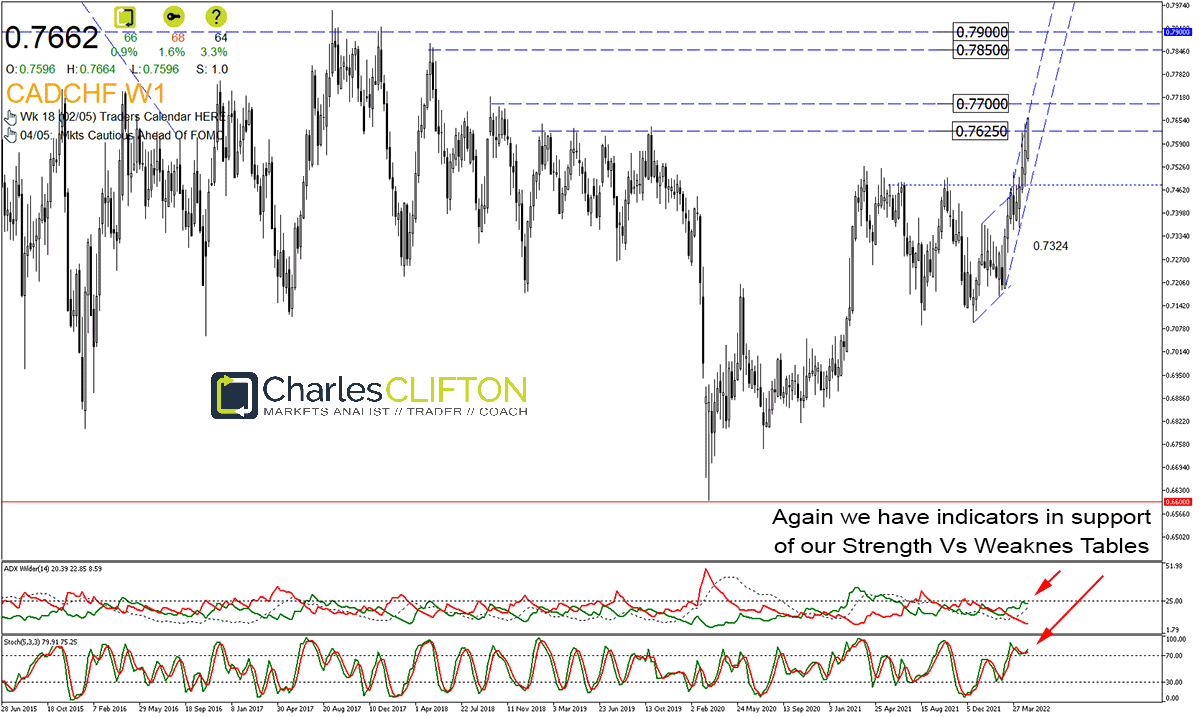
CADCHF Weekly Chart
Primary Observations:
- The weekly chart above shows us the bigger picture
- A confirmed daily close above 0.7625 would expose the 0.7700 handle
- A close back below 0.7625 would re-expose 0.7525 – and possible bull channel support
- A weekly close above the 0.7700 would be ideal as it would expose the 0.7850 / 0.7900 resistance areas
My Call:
- I am not currently trading this pair.
- I would be prepared to do so on a confirmed daily close above 0.7700
- Alternatively a close circa 0.7625 on contact with bull channel support would provide a safe long entry long.
- A removal of either CAD or CHF from my S/W Trading Tables (HERE) would of course negate this entire trade plan.

Leave A Comment
You must be logged in to post a comment.